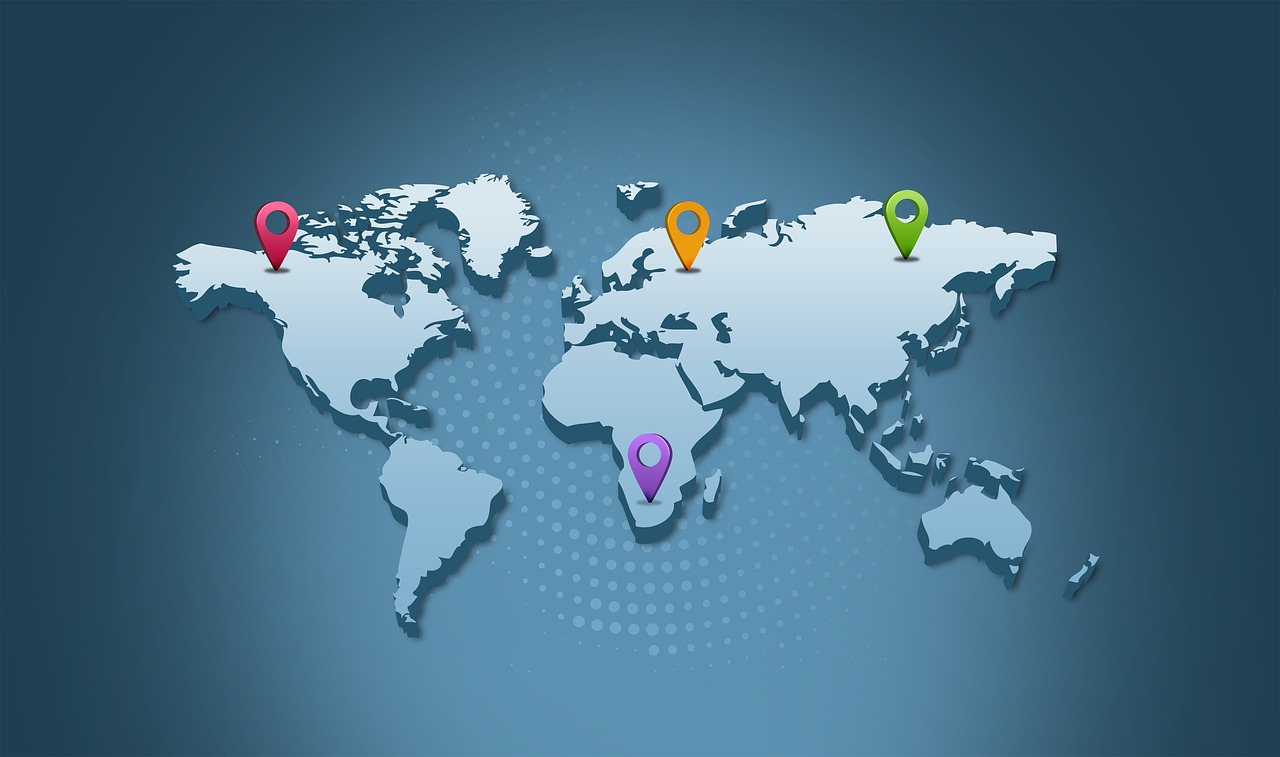
6 Tools That Can Help You Do A Geospatial Analysis
Posts by Alan TaylorAugust 24, 2022
Geospatial analysis is the study and use of techniques for handling geographic data in all forms, including visualization, analysis, management, and presentation. When this data is used in spatial modeling, it is often presented in the form of physical coordinates or, more indirectly, a street address, postal code, or identifier of a forest stand.
Geospatial analysis is to predict, manage, and learn about various phenomena that affect the earth, its methods and its inhabitants. Geospatial analysis has various uses, from crisis management and climate change modeling to weather monitoring and population forecasts to animal population control and sales analysis.
In the twenty-first century, geospatial technologies are used by various stakeholders, including public and private sector companies, academic and scientific communities, healthcare providers, local communities, and private citizens.
GIS (geographical information system) facilitates the study of environmental, demographic, and topographic data using data science and AI, making them helpful decision-making tools for any organization or industry. Today, a variety of tools and technologies are available that may help with the use of spatially linked data.
Read on to learn the usability and accessibility of this suite of tools that can aid geospatial analysis.
1. CARTO
Carto is a drag-and-drop analysis, open-source and powerful GIS tool. Carto’s cloud-native technology facilitates spatial analysis and generates accessible reports from location data. Moreover, it offers a data platform known as the Spatial Data Catalog, which provides users with access to high-quality data sets.
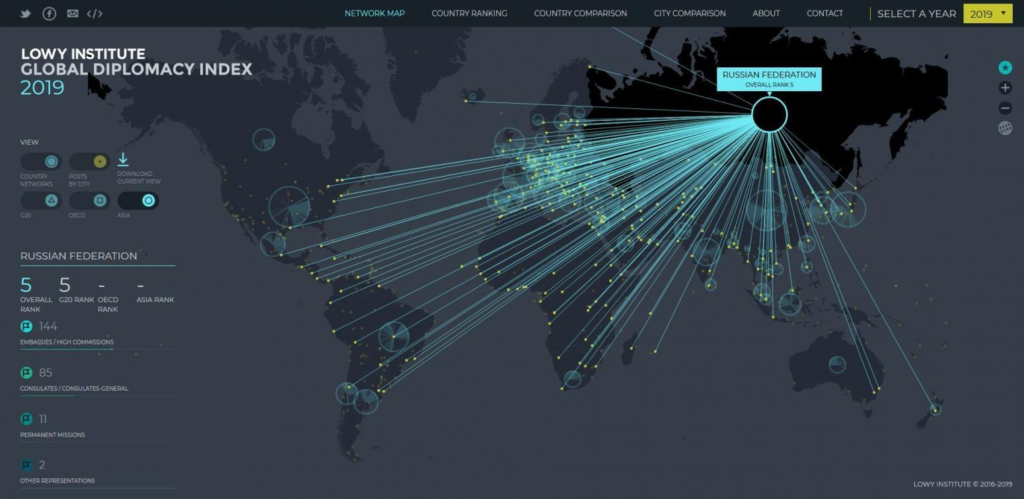
To have seamless integrations with the leading cloud data platforms and analytics tools, a geospatial analysis platform like Carto allows you to eliminate ETL complexity and limits on scalability.
These platforms include Google BigQuery, Snowflake, Amazon Redshift and Databricks. Carto’s platform is prepared to support your location-based choices on your terms, whether you want SaaS, private or public cloud, or on-premises deployment.
By using Carto Data Observatory’s streamlined access to hundreds of public and premium datasets, business enterprises may improve their geographical analysis using data like points of interest (POIs), people’s movement, credit card transactions, and more.
Carto allows you to quickly create location intelligence apps from scratch or modify one of its pre-made app templates. This gives your company a tool that key decision-makers will want to use in their day-to-day operations for market analysis, site selection or supply chain optimization.
Carto’s unique functions and features include:
- Personalized basemaps
- Observation Network
- Geocoding
- Isolines
With data and analysis, data scientists, developers and analysts may determine the where and the why of events, improve the efficiency of operations, and foresee potential consequences in geographically-based contexts.
2. ArcGIS
Most people working in the geospatial business are acquainted with tools developed by ESRI (Environmental Systems Research Institute), notably ArcGIS. ArcGIS has a ribbon user interface, 64-bit computing, and 3D integration.
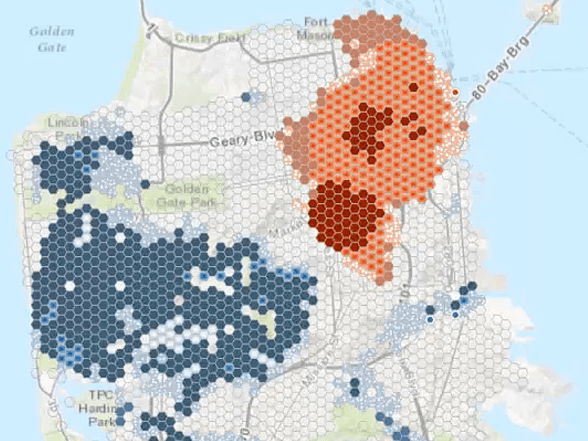
However, you will need to procure a license to use these products—which may be rather expensive, making them inaccessible to certain people and organizations.
However, ESRI provides free massive open online courses (MOOC) to teach you how to use ArcGIS Pro and/or ArcGIS Online for geospatial analysis. ArcGIS Pro, like its predecessors ArcMap, ArcCatalog, and ArcScene, is only available for download and use on Windows-based computers.
Create Buffers, Join Features, Find Hotspots, and Aggregate Points are just a few data analysis tools in ArcGIS Online. To help you choose which tools are ideal for your analysis, ArcGIS Online includes detailed explanations of their features and procedures.
3. Quantum GIS
Quantum Geographic Information System, or QGIS, is an open-source GIS that has seen rapid adoption over the last decade.
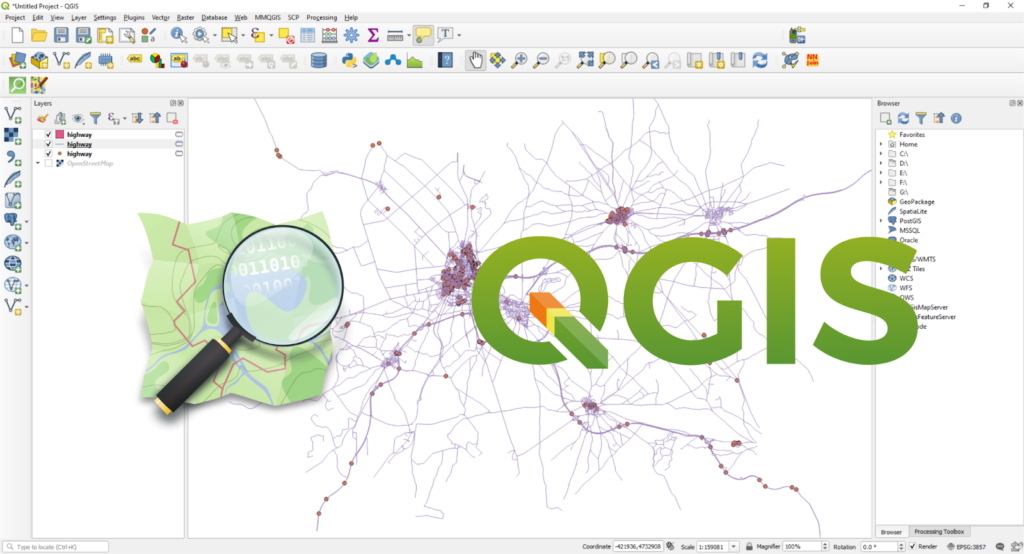
For many businesses and individuals, the low price of open source software, along with its many other advantages, has been the deciding factor in adopting it. QGIS is being used for analysis by both GIS technicians and data analysts. However, it may be expensive for big firms to offer every member a license to the software.
So instead—organizations are pushing workers to learn more about open source software and use it for their geospatial analysis. QGIS is a GIS software package that allows users to view, manage, edit, analyze, and print maps. QGIS’s features include—geocoding, merging diverse data types into a single picture, streaming data in real-time, a buffer zone query, and publishing all gathered data on a single map.
QGIS is available for download on various platforms, including Linux and Mac. QGIS isn’t as user-friendly as ArcGIS when describing how to utilize geoprocessing tools and what outputs they produce. Nonetheless, online geospatial forums can assist you in figuring out which tool (or tools) you may need to carry out your study.
The developers have made substantial online training materials available to help you use QGIS. There are several helpful plugins available for QGIS that are used to modify your data. Join by Attribute Value, Extract by Location, Topology Checker, Editing Toolbar, QuickMapServices Plugin and MMQGIS Plugin are all helpful processing tools and plugins available.
4. SAGA GIS
SAGA, or the “System for Automated Geoscientific Analysis”, GIS software is a computer application that modifies spatial data in a geographic information system. The software has evolved from its initial purpose as a terrain analyzer—using techniques like hill shading, watershed extraction, and visibility analysis to become a core GIS.
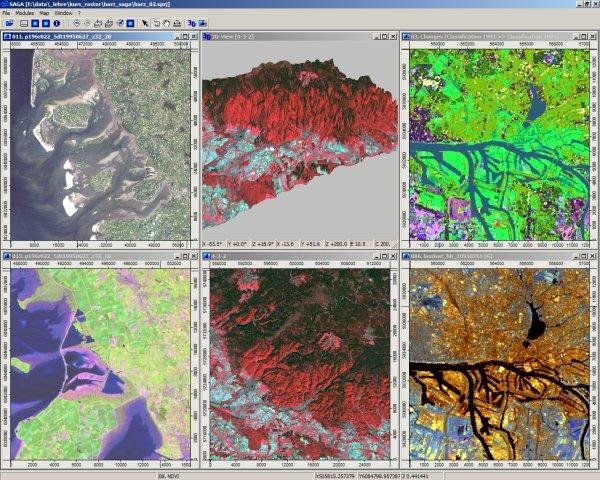
In addition to providing the geoscience community with a rapidly expanding collection of geoscientific techniques, the program also allows you to lay out all your information in several windows, including a map, histograms, scatter plots, attributes, and so on.
SAGA GIS’s goal is to provide researchers with a powerful but intuitive tool for putting geoscientific techniques into practice. APIs are what allow this to happen. The library of geoscientific techniques in SAGA is constantly expanding and may be easily swapped out for newer versions.
The SAGA topographic wetness index and topographic position classification are only two of the many powerful and novel morphometry tools included in the tool. The tool’s true worth is shown in the context of terrain analysis. SAGA GIS is quick, trustworthy, and precise.
SAGA GIS can run on Microsoft Windows, Linux, and FreeBSD. When used with other GIS programs like Kosmo and QGIS, SAGA GIS may provide even more granularity in vector datasets and higher-resolution map-making options.
5. GRASS GIS
GRASS GIS has been evolving continuously since its inception in 1982, making it one of the longest-running open-source geospatial programs. GRASS GIS is developed for managing vector and raster geographic data, geoprocessing, spatial modeling, and visualization.

In a unified platform, it provides robust tools for processing geographic data in raster, vector, and geospatial formats. Tools for processing satellite and aerial photography, managing and analyzing geospatial data, visualizing raster and vector data, and modeling topography and ecosystems are all a part of this suite.
GRASS GIS includes a Python API for quick geospatial programming and a temporal framework for complex time series analysis. Performance and processing massive amounts of geographical data are two areas where GRASS GIS has been fine-tuned.
GRASS GIS is cross-platform and may be used on Linux, Mac OS X, and Microsoft Windows. GRASS GIS has a user-friendly graphical user interface (GUI) and a command line syntax that may be used in production and automation.
The features of GRASS GIS include:
- Support for practically all popular GIS file formats through the GDAL-OGR library
- LiDAR and network analysis
- Geoprocessing with over 350 top-notch modules
- High-tech, satellite-based imaging instruments
- It allows for arbitrary rasterization of three-dimensional space and user modification
- Offers tools that work with raster, vector, images, and time
More than 500 modules exist in GRASS GIS for handling and displaying geographical information. With this program, you may do basic to complex geographical analysis and modeling with a wide range of supported raster, vector, and 3D file types.
6. GeoDa
GeoDa is a powerful tool capable of performing geographic analysis, multivariate exploratory data analysis and global and local spatial autocorrelation.
This software uses dynamic linking and brushing methods, making it ideal for exploratory data analysis and geographical visualization. GeoDa can generate histograms, box plots, and Scatter plots to do fundamental exploratory analysis.
What’s most crucial, however, is that users have the option to map and connect those analytic tools with the geographical spread of the phenomena they’re analyzing.
GeoDa’s characteristics include:
- Open source software licensing
- Futuristic interface and design
- Geosimulation with data presentation
- Data exploration to better understand statistics
- Plethora of modern charts and graphs
GeoDa is compatible with several Windows, Mac OS, and Linux. GeoJSON, shapefiles, MapInfo, GML, geodatabase, KML, and other GDAL-compatible vector data formats are all supported by GeoDa. It also provides multi-layer functionality for evaluating statistical findings and models through connected charts and maps.
Wrapping up
The right geospatial tools may do wonders for your data-analyzing and transform it into actionable insights for your business. Many businesses may improve their services to customers by making more informed decisions based on geospatial data analysis.
Many sectors, including telecommunications and networking, urban planning, transportation planning, environmental impact analysis, disaster management, and many more, are moving forward to equip themselves with geospatial data for the future. You may choose from the options above if you’re looking to analyze and modify your data using geospatial technologies.
